Why Teams Use It
Daily capacity goes up fast
Instead of reading invoices line by line and rebuilding the same spreadsheet every time, your team starts with an extracted quote-sheet structure in minutes and can work more quote opportunities per day.

Telecom Savings Intelligence
From original carrier invoices to quote-ready exports and executive reporting.
Reduce manual bill work. Increase quote capacity.
AuditSpark helps telecom teams stop rebuilding spreadsheets by hand, move returned pricing faster, and present savings on a branded dashboard that customers can follow in real time.
Outcome
Less manual work
Start with structured bill data instead of rebuilding quote sheets line by line.
Capacity
More quotes per day
Free analysts and advisors to move opportunities forward instead of cleaning up source bills.
Presentation
Live savings dashboard
Show the customer a professional dashboard instead of narrating an Excel file.
Before vs After
Before AuditSpark
After AuditSpark
Best Fit
If your team already knows how to find telecom savings but loses time rebuilding bills and explaining spreadsheets, this is the workflow layer built to fix that.
Video Showcase
See the exact story a customer sees: current spend, future spend, monthly savings, and location-driven drilldown presented in a cleaner way than an Excel walk-through.
Customer-Facing Output
The end result is a report your customer can follow by location, by category, and by service line in real time instead of a giant spreadsheet that forces you to narrate every number.
Location-Driven Navigation
What Customers See
Live savings by location
The customer can move location-by-location and instantly understand where the biggest opportunities sit without digging through Excel tabs.
Current Spend
$4,917
Future Spend
$3,299
Monthly Savings
$1,618
Annual Savings
$19,416
Biggest Offenders
Largest cost targets
Line Item Detail
Clean comparison table
| TN / Circuit | Current | Future | Savings |
|---|---|---|---|
| CIR-YHI-ETH-01 | $918 | $645 | $273 |
| 207-363-5119 | $486 | $322 | $164 |
| LD-CONF-POOL | $154 | $66 | $88 |
Project Creation
Show how teams can start a new project, select an existing one, and keep customer work organized before moving into extraction, quoting, and presentation.
Executive Summary PDF
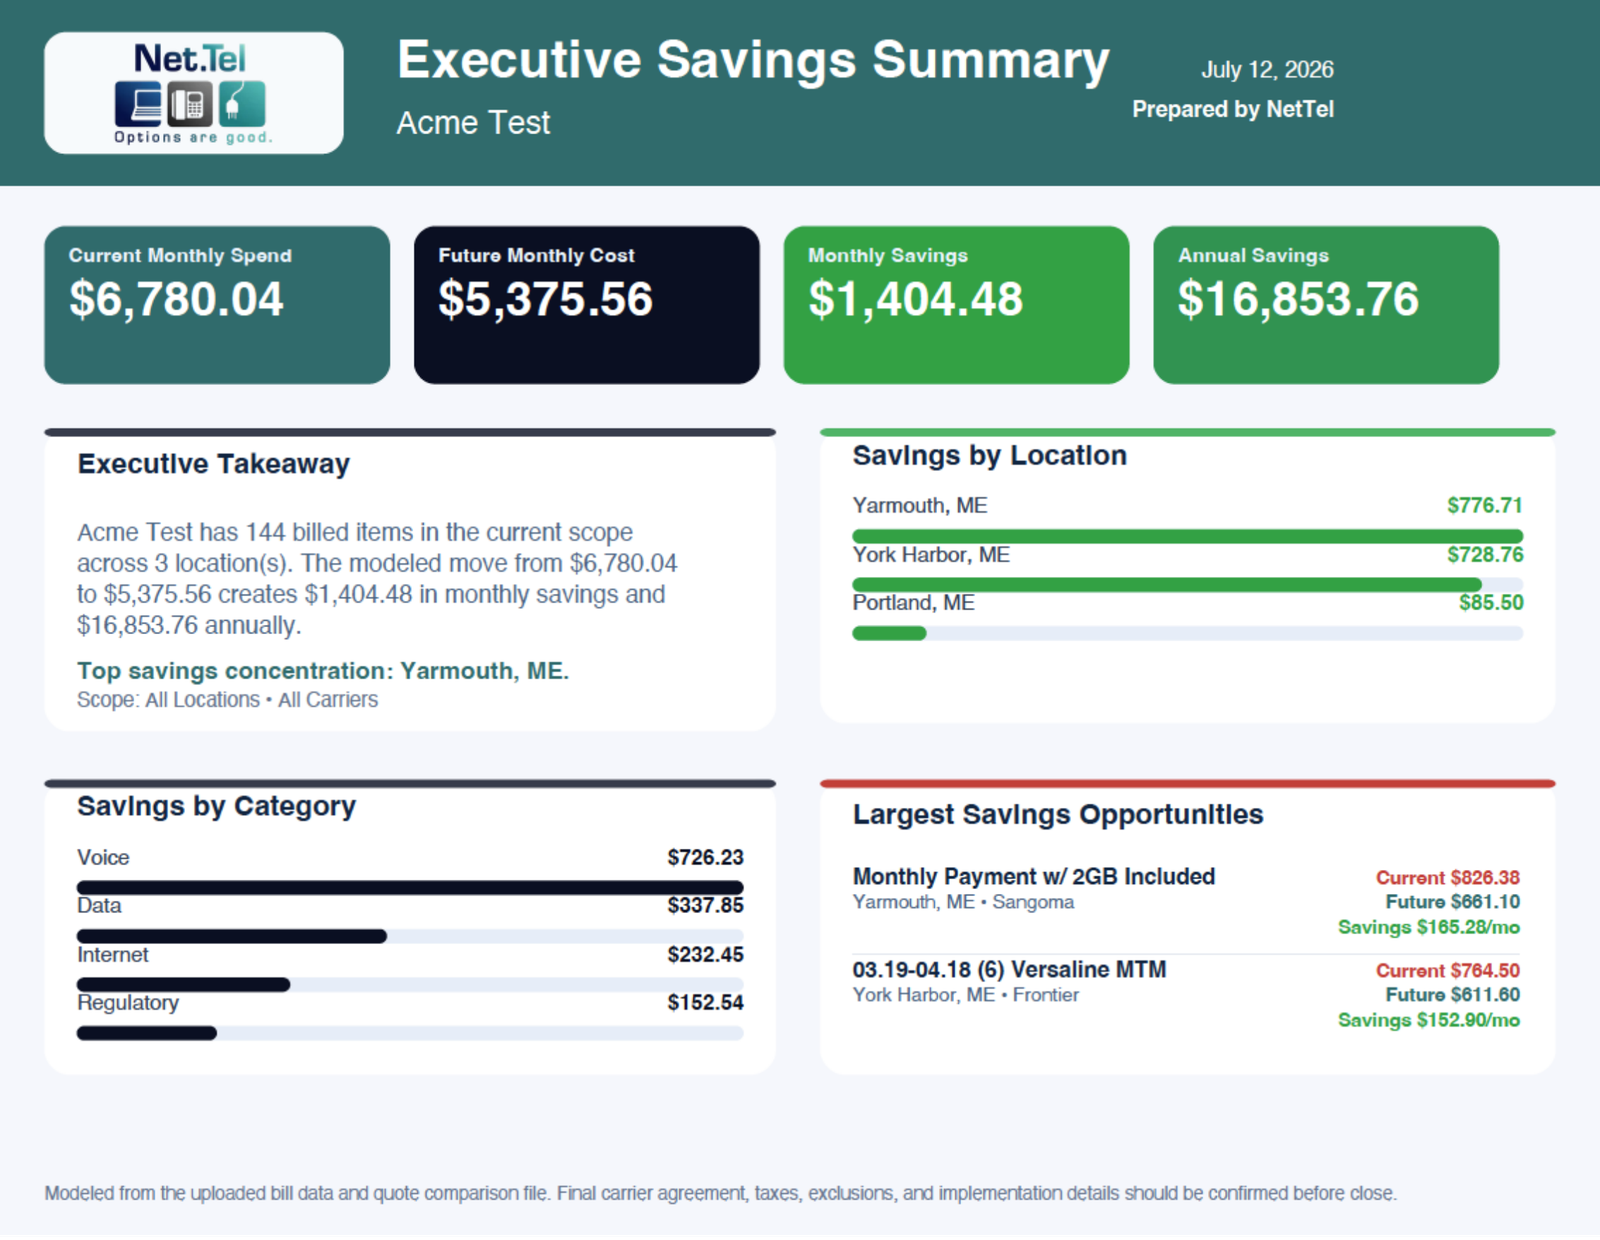
Every new project can generate a polished executive summary PDF with branded presentation, headline savings numbers, and a customer-ready leave-behind summary.
AuditSpark-branded sample for the marketing site
The showcase preview uses the AuditSpark mark so the page stays visually consistent from header to proof section.
Built from the same project data as the dashboard
Current spend, future cost, monthly savings, annual savings, and summary visuals stay presentation-ready.
Made for download and handoff
Useful when you want a leave-behind summary in addition to the live dashboard conversation.
Workflow
3 steps
Bill in, quote sheet out, savings dashboard on screen.
Presentation
Branded
Use your colors and logos in exports and downstream reporting.
Reporting
Location-driven
Customers see where the savings sit by site, category, and service line.
Output
Client-ready
Move from messy invoices to polished quoting and executive presentation.
Why Teams Use It
Instead of reading invoices line by line and rebuilding the same spreadsheet every time, your team starts with an extracted quote-sheet structure in minutes and can work more quote opportunities per day.
Why Customers Trust It
AuditSpark keeps the report grounded in locations, circuits, and line items so the customer can instantly see what is changing and why it matters without translating spreadsheet rows.
Why Customers Get It
Apply the customer logo and colors to quote-sheet exports and downstream reporting so you can present a polished live dashboard instead of talking through an Excel sheet.
Pricing Plans
Starter
$31/mo annual
Pages / mo
200
AuditSpark-branded workflow for smaller teams that want structured bill extraction and cleaner carrier quote prep.
Growth
$79/mo annual
Pages / mo
1,500
Adds customer-branded presentation value so the quoting workflow and the customer meeting both feel more polished.
Professional
Most Popular$199/mo annual
Pages / mo
5,000
Built for heavier quoting volume, more branded reporting, and teams that want AuditSpark embedded deeper in the workflow.
Monthly plans are shown before annual discount.
Annual plans reflect 20% savings.
Ready to Show It?
AuditSpark.ai helps telecom advisors remove manual bill work, increase quote throughput, and present savings in a live branded dashboard instead of rebuilding and explaining the same spreadsheet over and over.